About GenSkew
GenSkew is an application for computing and plotting nucleotide skew data.
GenSkew calculates the incremental and the cumulative skew of two selectable nucleotides for a given sequence according to this formula: Skew = (nucleotide1 - nucleotide2) / (nucleotide1 + nucleotide2)
The results are provided as data table and as graphical plot. The global minimum and maximum are displayed in the cumulative graph. The minimum and maximum of a GC-skew can be used to predict the origin of replication (minimum) and the terminus location (maximum) in prokaryotic genomes.
There are four versions of this Program: Genskew_univiecube (the python library), Genskew_cc (a commandline client), GUIskew (the graphical version of GenSkew) and Webskew (the online version).
The Faces of GenSkew
Every version of GenSkew has its own page, where you can find detailed explaination of usage and other information on them.
Genskew_cc
Genskew_cc is the commandline client for GenSkew. It can be installed via pypi page.
After installing, type
$ python3 -m genskew -h
and you will be presented with a detailed description of how to use it.
GUIskew
GUIskew is the graphical version of GenSkew. Here you can find how to use it. For linux and mac it can be installed via the pypi page IF you already have tkinter installed. On most Linux distros you can install tkinter by the following command:
$ apt-get install python-tk
For Windows the Programm can also be downloaded here:
Webskew
Webskew is the online version of GenSkew. it functions exactly the same as the GUIskew program. Here you can find how to use it.
Genskew_univiecube
Genskew_univiecube is the python library and the backend for all other GenSkew programs. Here you can find how to use it.. It can be installed via the pypi page.
The Graph
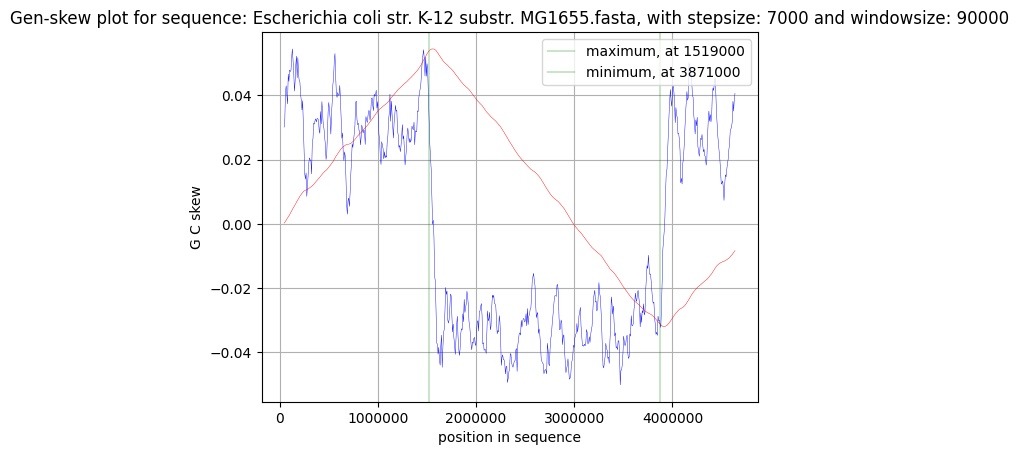
The Graph you get back from the program should look a bit like the example graph above. It consists of two lines: the blue skew line and the red cumulative skew line.
The Skew
The blue figure displays the skew over the length of the genome. It is calculated by seperating the genome into windows. In these windows the two chosen nucleotides get counted and subjected to the formula:
Skew = (nucleotide1 - nucleotide2) / (nucleotide1 + nucleotide2)
while the x axis is the position in the genome and the y axis the skew.
The Cumulative Skew
The ccumulative skew adds up all previous values to a specific position. It also displays the global minimum and maximum, which are shown in the graph by the two green lines. These predict the origin of replication (minimum) and the terminus location (maximum) in prokaryotic genomes.
Furthermore you can change the graph to a SkewIT¹ graph in every version.
References
1: SkewIT, https://journals.plos.org/ploscompbiol/article?id=10.1371/journal.pcbi.1008439 (06.04.2022), SkewIT: The Skew Index Test for large scale GC Skew analysis of bacterial genomes, Jennifer Lu, Steven L. Salzberg